
































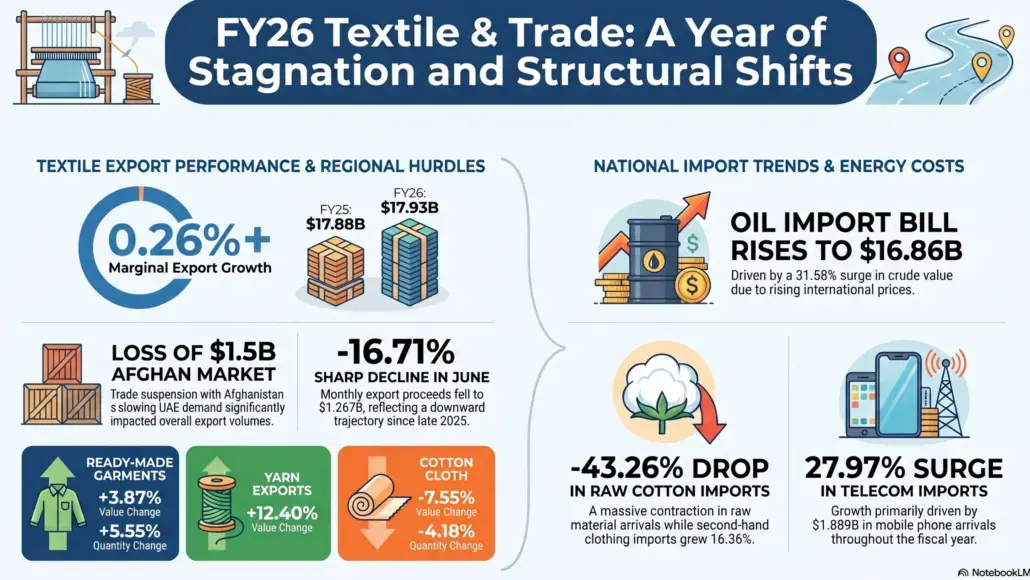
The fiscal year 2026 concluded with textile and clothing exports reaching $17.93 billion, representing a marginal growth of 0.26 percent compared to the $17.88 billion recorded in the previous year. This performance highlights the sector’s ongoing struggle to maintain momentum amidst rising production costs and fluctuating demand in key regional markets. These Textile Export Trends reflect a period of stagnation, with the industry facing significant hurdles in both domestic operations and international trade logistics.
Sector Challenges and Regional Market Dynamics
Official data indicates that merchandise exports missed the annual target by $4.87 billion for the fiscal year. This contraction suggests a lack of visible improvement in the trade balance over the last four years. A major factor in this downturn was the suspension of trade with Afghanistan, which had previously emerged as an export market valued at nearly $1.5 billion. Furthermore, exports to the Middle East, particularly to the UAE, lost significant pace during the year, further impacting the overall volume of textile and clothing exports.
In June alone, the sector experienced a sharp decline of 16.71 percent, with export proceeds falling to $1.267 billion from $1.521 billion in the corresponding month of the prior year. Since October 2025, the trajectory has remained largely in negative territory, with only brief marginal upticks recorded in January and April. Elevated production costs continue to erode the competitiveness of local manufacturers on the global stage, making it difficult to sustain growth.
Performance of Key Product Categories
Within the textile sector, the performance of specific categories varied throughout FY26. Ready-made garments posted a growth of 3.87 percent in value and 5.55 percent in quantity. However, knitwear saw a decline of 0.88 percent in value, while bedwear remained nearly flat with a 0.01 percent dip in value despite a slight increase in quantity. Towel exports and cotton cloth also faced downward pressure, with the latter dropping by 7.55 percent in value and 4.18 percent in quantity.
Conversely, yarn exports showed resilience, surging by 12.40 percent during the fiscal year. On the import side, the arrival of raw cotton saw a significant decrease of 43.26 percent, while the import of second-hand clothes grew by 16.36 percent. The import of synthetic fiber and silk yarn also saw increases of 7.25 percent and 3.89 percent, respectively.
Energy and Telecommunication Import Shifts
The national oil import bill reached $16.862 billion in FY26, a 5.76 percent increase from the $15.943 billion recorded the previous year. This rise was primarily driven by petroleum crude imports, which surged 31.58 percent in value. This increase in expenditure is largely attributed to rising international oil prices rather than volume alone, as the quantity of petroleum products actually saw a slight decline of 0.50 percent. Meanwhile, imports of liquefied natural gas fell by 36.10 percent, while liquefied petroleum gas grew by 3.21 percent.
The telecommunication group also saw a notable surge in activity, with imports rising by 27.97 percent year-on-year. This was mainly due to a 26.55 percent increase in mobile phone arrivals, totaling $1.889 billion. These shifts in import requirements, alongside the current Textile Export Trends, define the complex economic landscape of the past fiscal year as the country navigates volatile international oil prices and shifting merchandise exports targets.